How to read a stock chart is a beginner skill that prevents two mistakes: ignoring price history entirely, and treating squiggles as a fortune-telling service. A chart shows what traders did. Your job is to decide whether that history is relevant to a multi-year holding.
Price and axes
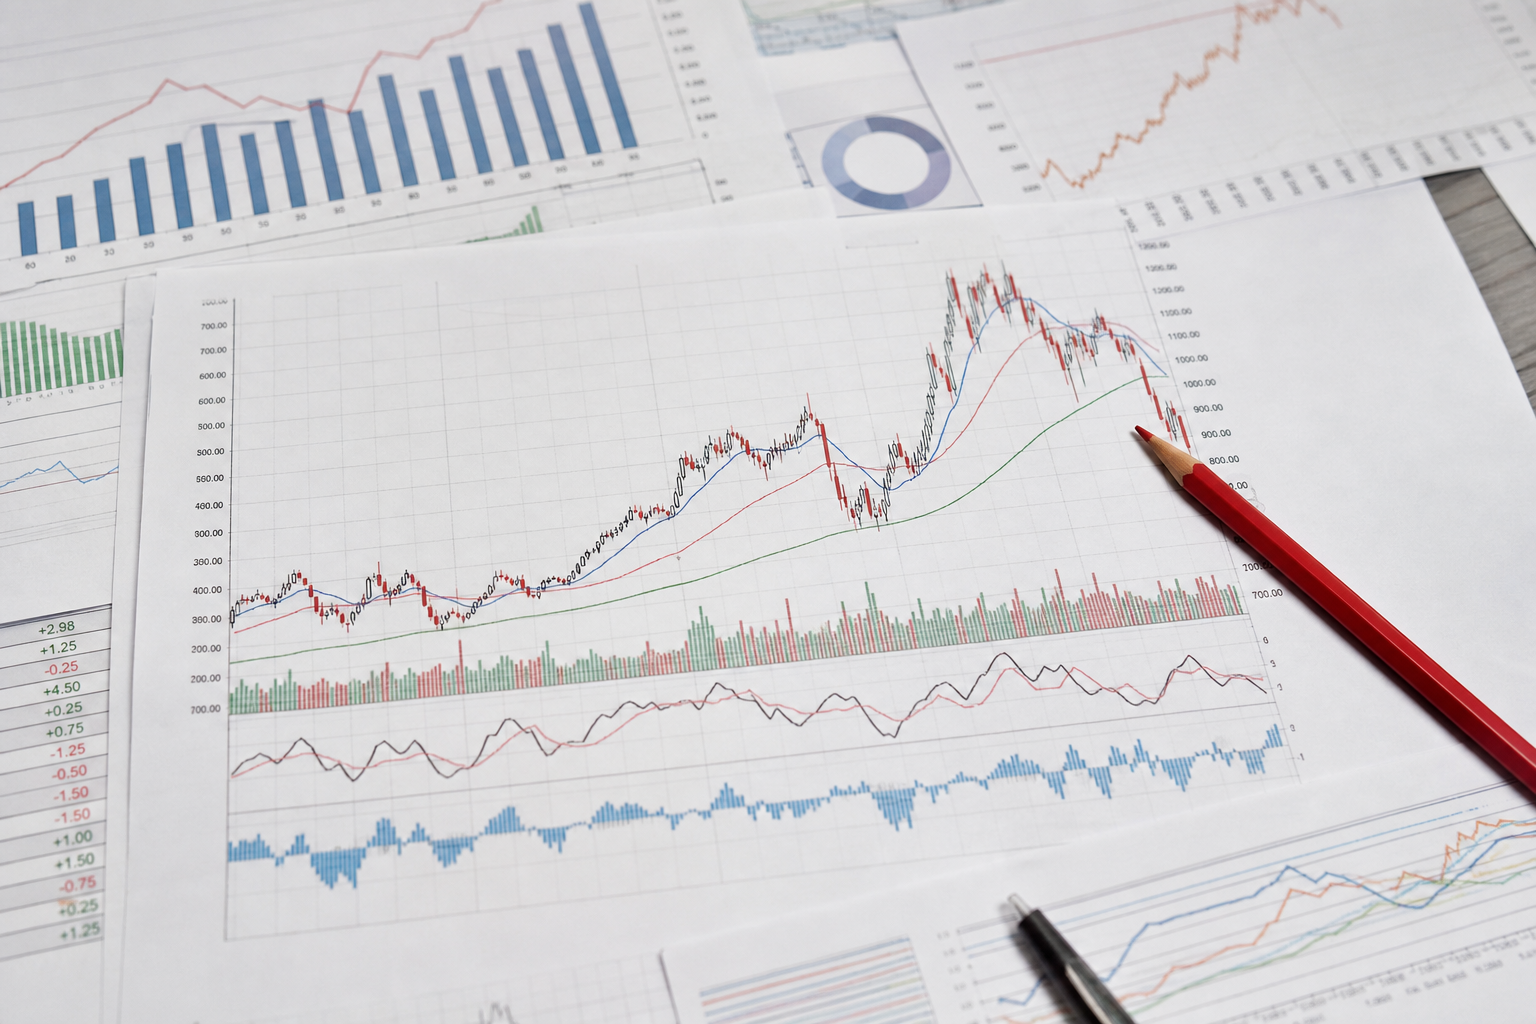
The vertical axis is price; the horizontal is time. Zoom out before you zoom in. A dramatic afternoon on a five-minute chart can be a footnote on the weekly.
Volume
Volume shows participation. A move on tiny volume is less informative than a move everyone traded. For long-term investors, volume is context, not a trigger to mash the buy button.
Moving averages
A moving average smooths price. When price sits far above a long average, the stock has already had a run. That can continue. It can also mean you are paying up. It is not a buy/sell oracle.
Gaps and news
Stocks gap on earnings and headlines. If you cannot explain a gap, do not invent a pattern name for it. Read what the company reported.
Charts plus a plan
Use charts to avoid buying a name only because a friend mentioned it at a party. Then size the position. Orizon Invest shows live prices so you can act on a plan, not on a mystery screenshot from somewhere else.